heappo: a WinDBG extension for heap tracing

Preface
During these days of forced quarantine time-off, I have been reviewing notes and exercises from the outstanding Corelan Advanced training I took last October at Brucon, and so I decided to work on some tooling I had in mind lately. The idea came from thisresearch by Sam Brown from F-Secure: after testing the tool I decided to port it to the latest PyKD version to support both Python3 and Python2, and can run on both x86 and x64 (tested on latest Win10 1909) I aptly named this effort Heappo and here some of its key-features and enhancements.
Setup and Usage
Depending on the architecture of our target application, we want to install the correct PyKD ext version. If everything is properly arranged, we can test the script from within WinDBG console:
.load pykd
!py heappo.py <heap_alloc_size> log=<on/off>
The script takes two parameters, one to specify the allocation size and the second to optionally log all the output to a file in the user’s home folder. To dump any allocation, regardless of its size, we can issue “null” instead of a specific value.
As an example, we could filter all the alloc/realloc of size 0x20.
!py heappo.py 0x20 log=on
RtlAllocateHeap(0x500000L , 0x8L , 0x20L) = 0x5bf240 - From: 0x71403c96
RtlAllocateHeap(0x500000L , 0x8L , 0x20L) = 0x5bf1f0 - From: 0x711e9dc5
RtlAllocateHeap(0x500000L , 0x8L , 0x20L) = 0x5be750 - From: 0x711e9dc5
RtlFreeHeap(0x500000L , 0x0L , 0x5e4b08L) = 0x1 - From: 0x75fa14dd
RtlFreeHeap(0x500000L , 0x0L , 0x5c4398L) = 0x1 - From: 0x75fa14dd
RtlFreeHeap(0x500000L , 0x0L , 0x593468L) = 0x1 - From: 0x75fa14dd
RtlFreeHeap(0x500000L , 0x0L , 0x5c3660L) = 0x1 - From: 0x75fa14dd
RtlFreeHeap(0x500000L , 0x0L , 0x593330L) = 0x1 - From: 0x75fa14dd
RtlFreeHeap(0x500000L , 0x0L , 0x5e4b68L) = 0x1 - From: 0x75fa14dd
RtlFreeHeap(0x500000L , 0x0L , 0x5e4b08L) = 0x1 - From: 0x75fa14dd
Obviously, the “RtlFreeHeap” could not be filtered, since no size argument is passed. Visualizing the heap will help us on this task - more on that later.
Features
Heappo is employing all the functionalities made available by PyKD, in particular function hooking and offset calculation. By placing an inline breakpoint, it can inspect and dump function arguments and return values. It aims to log, both on screen and optionally to a logfile any heap interaction that is happening on the target program.
- RtlAllocateHeap
- RtlReAllocateHeap
- RtlFreeHeap
- VirtualAlloc
The tool can also catch any explicit use of VirtualAlloc, in the same manner as the other Rtl*Heap functions. If we take a closeup at VirtualAlloc’s function prototype and stdcall calling convention
VirtualAlloc(
   LPVOID lpAddress,
   SIZE_T dwSize,
   DWORD flAllocationType,
   DWORD flProtect
   );
we can then build a class that places two breakpoints, one at the very start (to fetch parameters) and one at the return, to grab the return value and the Saved Return Pointer (SRP). The class handle_virtual_alloc is implemented with two callback functions, each responsible to place its own breakpoint and retrieve values.
class handle_virtual_alloc(pykd.eventHandler):
    def __init__(self):
        addr = format64(get_address("kernel32!VirtualAlloc"))
        if addr == None:
            return
        self.bp_init = pykd.setBp(int(addr, 16), self.enter_call_back)
        self.bp_end = None
The first callback is responsible for dumping the passed parameters by accessing them through ESP offsets (x86) or directly from registers (x64).
def enter_call_back(self):
    self.out = "VirtualAlloc("
    if arch_bits == 32:
        esp = pykd.reg(stack_pointer)
        self.out += hex(pykd.ptrPtr(esp + 4)) + " , "
        self.out += hex(pykd.ptrMWord(esp + 0x8)) + " , "
        self.out += hex(pykd.ptrMWord(esp + 0xC)) + " , "
        self.out += hex(pykd.ptrMWord(esp + 0x10)) + ") = "
    else:
        self.out += hex(pykd.reg("rcx")) + " , "
        self.out += hex(pykd.reg("rdx")) + " , "
        self.out += hex(pykd.reg("r8")) + " , "
        self.out += hex(pykd.reg("r9")) + ") = "
    if self.bp_end == None:
        disas = pykd.dbgCommand("uf kernelbase!VirtualAlloc").split('\n')
        for i in disas:
            if 'ret' in i:
                self.ret_addr = format64(i.split()[0])
                break
        self.bp_end = pykd.setBp(int(self.ret_addr, 16), self.return_call_back)
    return False
def return_call_back(self):
     esp = pykd.reg(stack_pointer)
     self.out += hex(pykd.reg(return_reg))
     self.out += " - From: " + (hex(pykd.ptrPtr(esp))).replace('L','')
     print(self.out)
     if logging:
         log.write(self.out + "\n")
     return False
High visibility
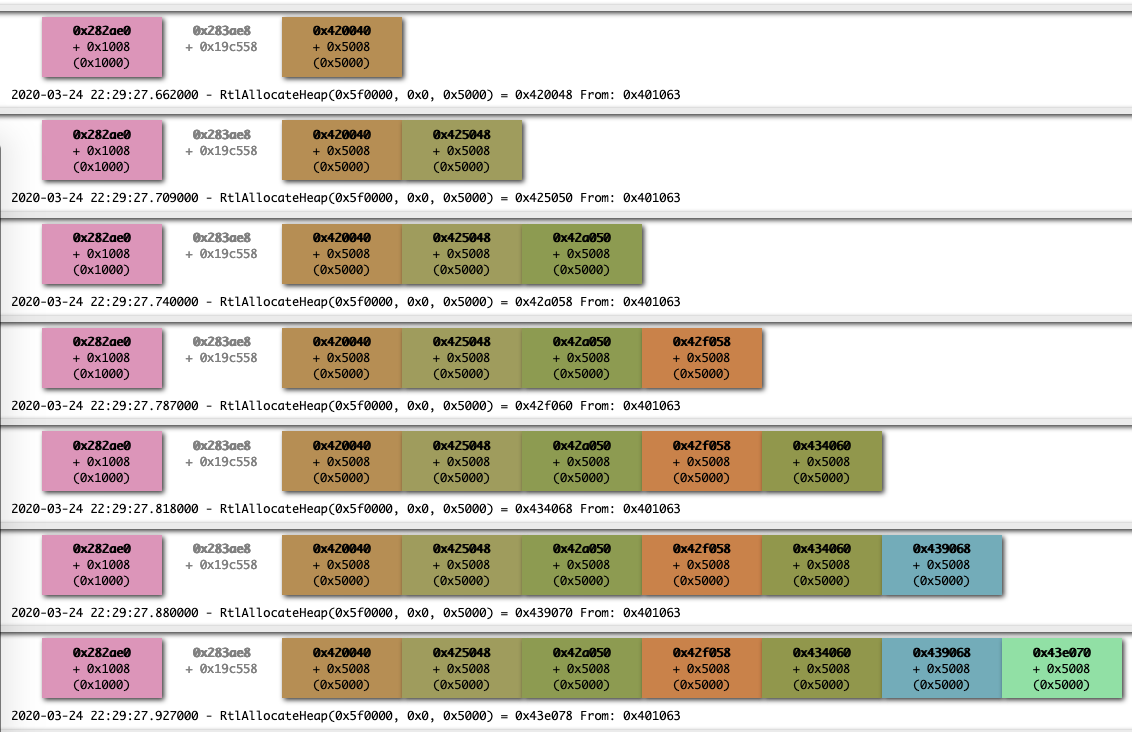
One further step that we can take is to visualize heap beahvior with with a dynamically generated HTML graph. So I took Sam’s custom Villoc script and added support for the “Caller” function and timestamps.
This script, given heappo log file, can generate the whole graph with:
python villoc.py session.log output.html
Which can give us a nice layout of how chunks are allocated over time, grouped by base address.
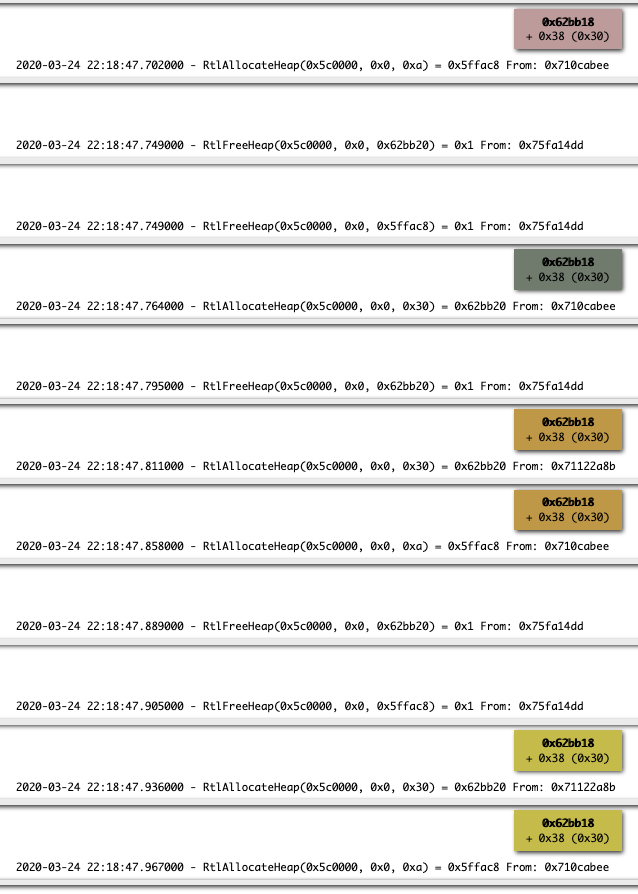
‘Frees’ can be extremely easy to catch as well: here we can spot how the same chunk gets allocated and freed multiple times:
This is just a starting point that I sketched during the last few days but there’s a lot of room for improvements, The whole project can be grabbed here